
Module, Dashboard & Board
The CoB platform has 5 important concepts in relation to accessing and visualizing information:
1. Server
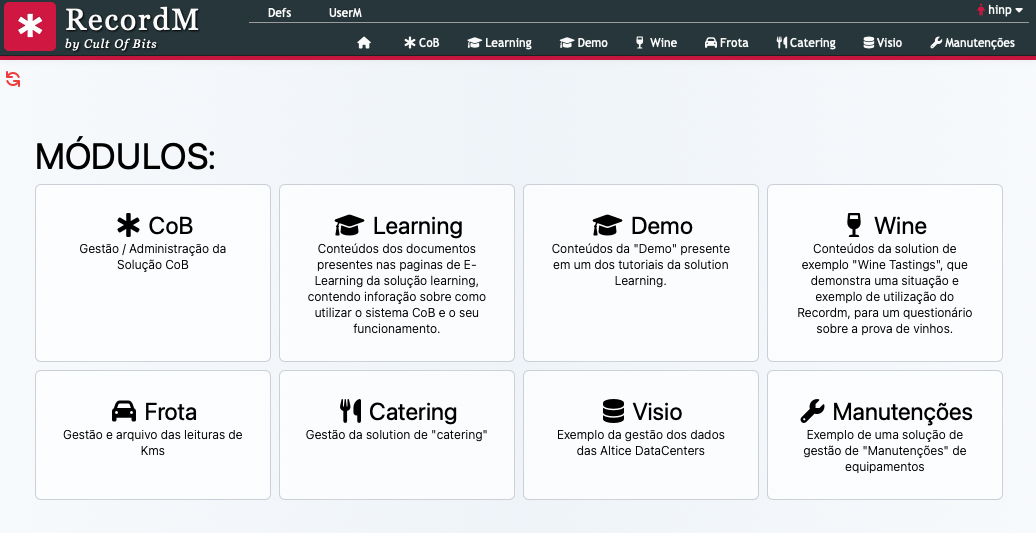
The server is the machine where the CoB platform runs and where you can access the different modules that are configured for your server.
When you enter your server you'll see a page similar to the one below, with a list of all the modules that you have access too:
2. Module
A module is a group of:
- Domains
- Definitions
- Dashboards (visualization panels)
- Users
That together serve to solve a need.
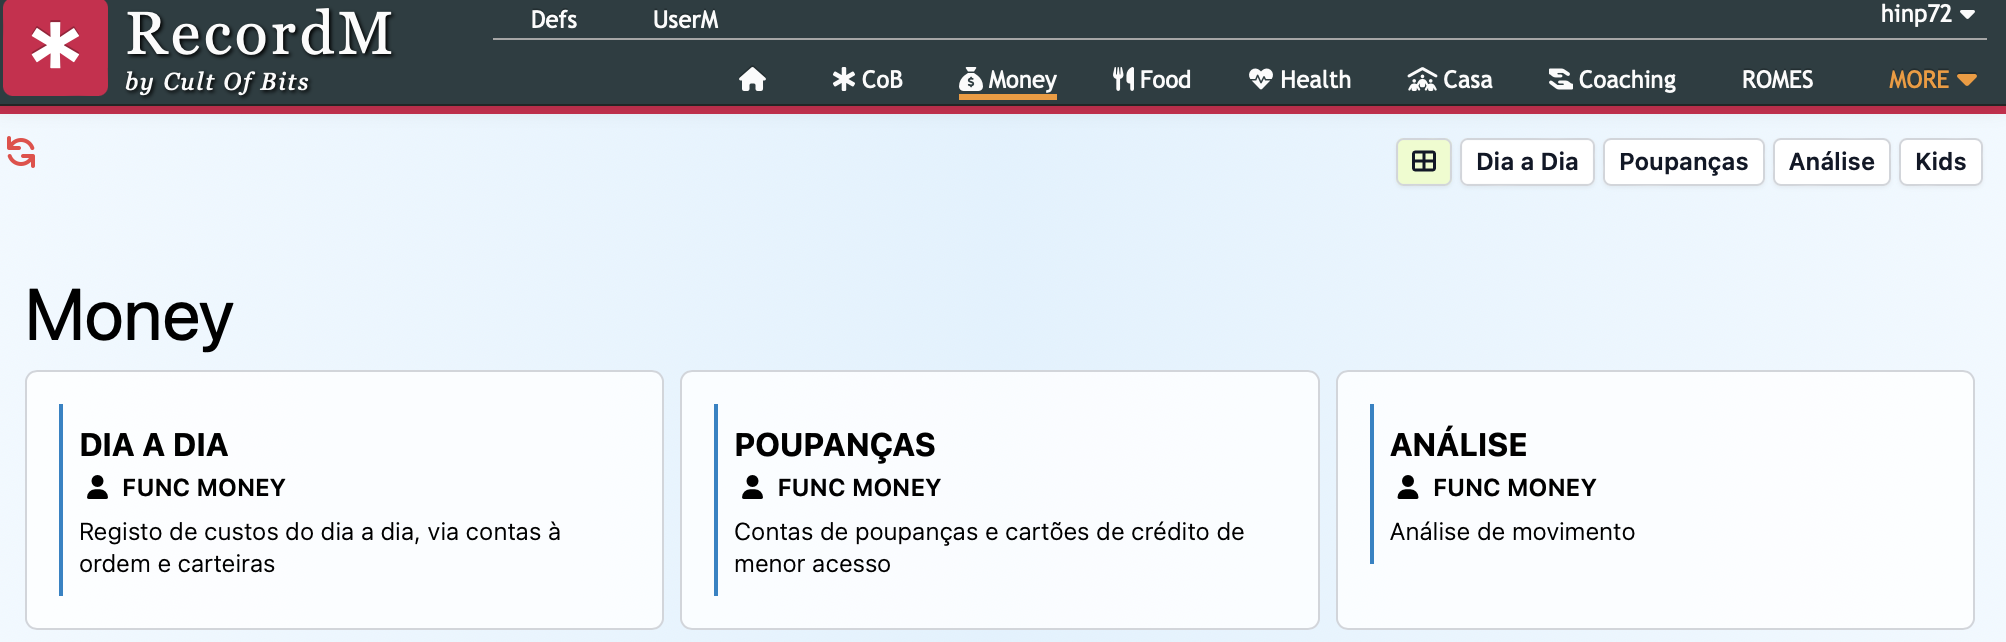
When you click on a module you see a page similar to the one below, with a list of all the module's Dasboards that you can access. In the example below, you can see the Money module with the "Dia a Dia", "Poupanças" and "Análise" Dashboards that also appear in a new menu in the top right corner:
3. Dashboard (Visualization Panel)
A Dashboard is a page that facilitates access to information and functionalities of the module to which it belongs, according to the user: it can serve a large number of purposes, such as containing company information, metrics and indicators. The idea is that the numbers relevant to business strategy, performance and achievement of organizational objectives can be represented.
These are highly specific and completely customizable HTML pages. These panels allow you to present results from multiple sources of data. The Dashboard design is important, since the focus is on easy, clear and objective visualization.
In the image below you can see the Maintenance Dashboard with several Boards - the first for search, the second with the number of records of 3 definitions and the third with a calendar:
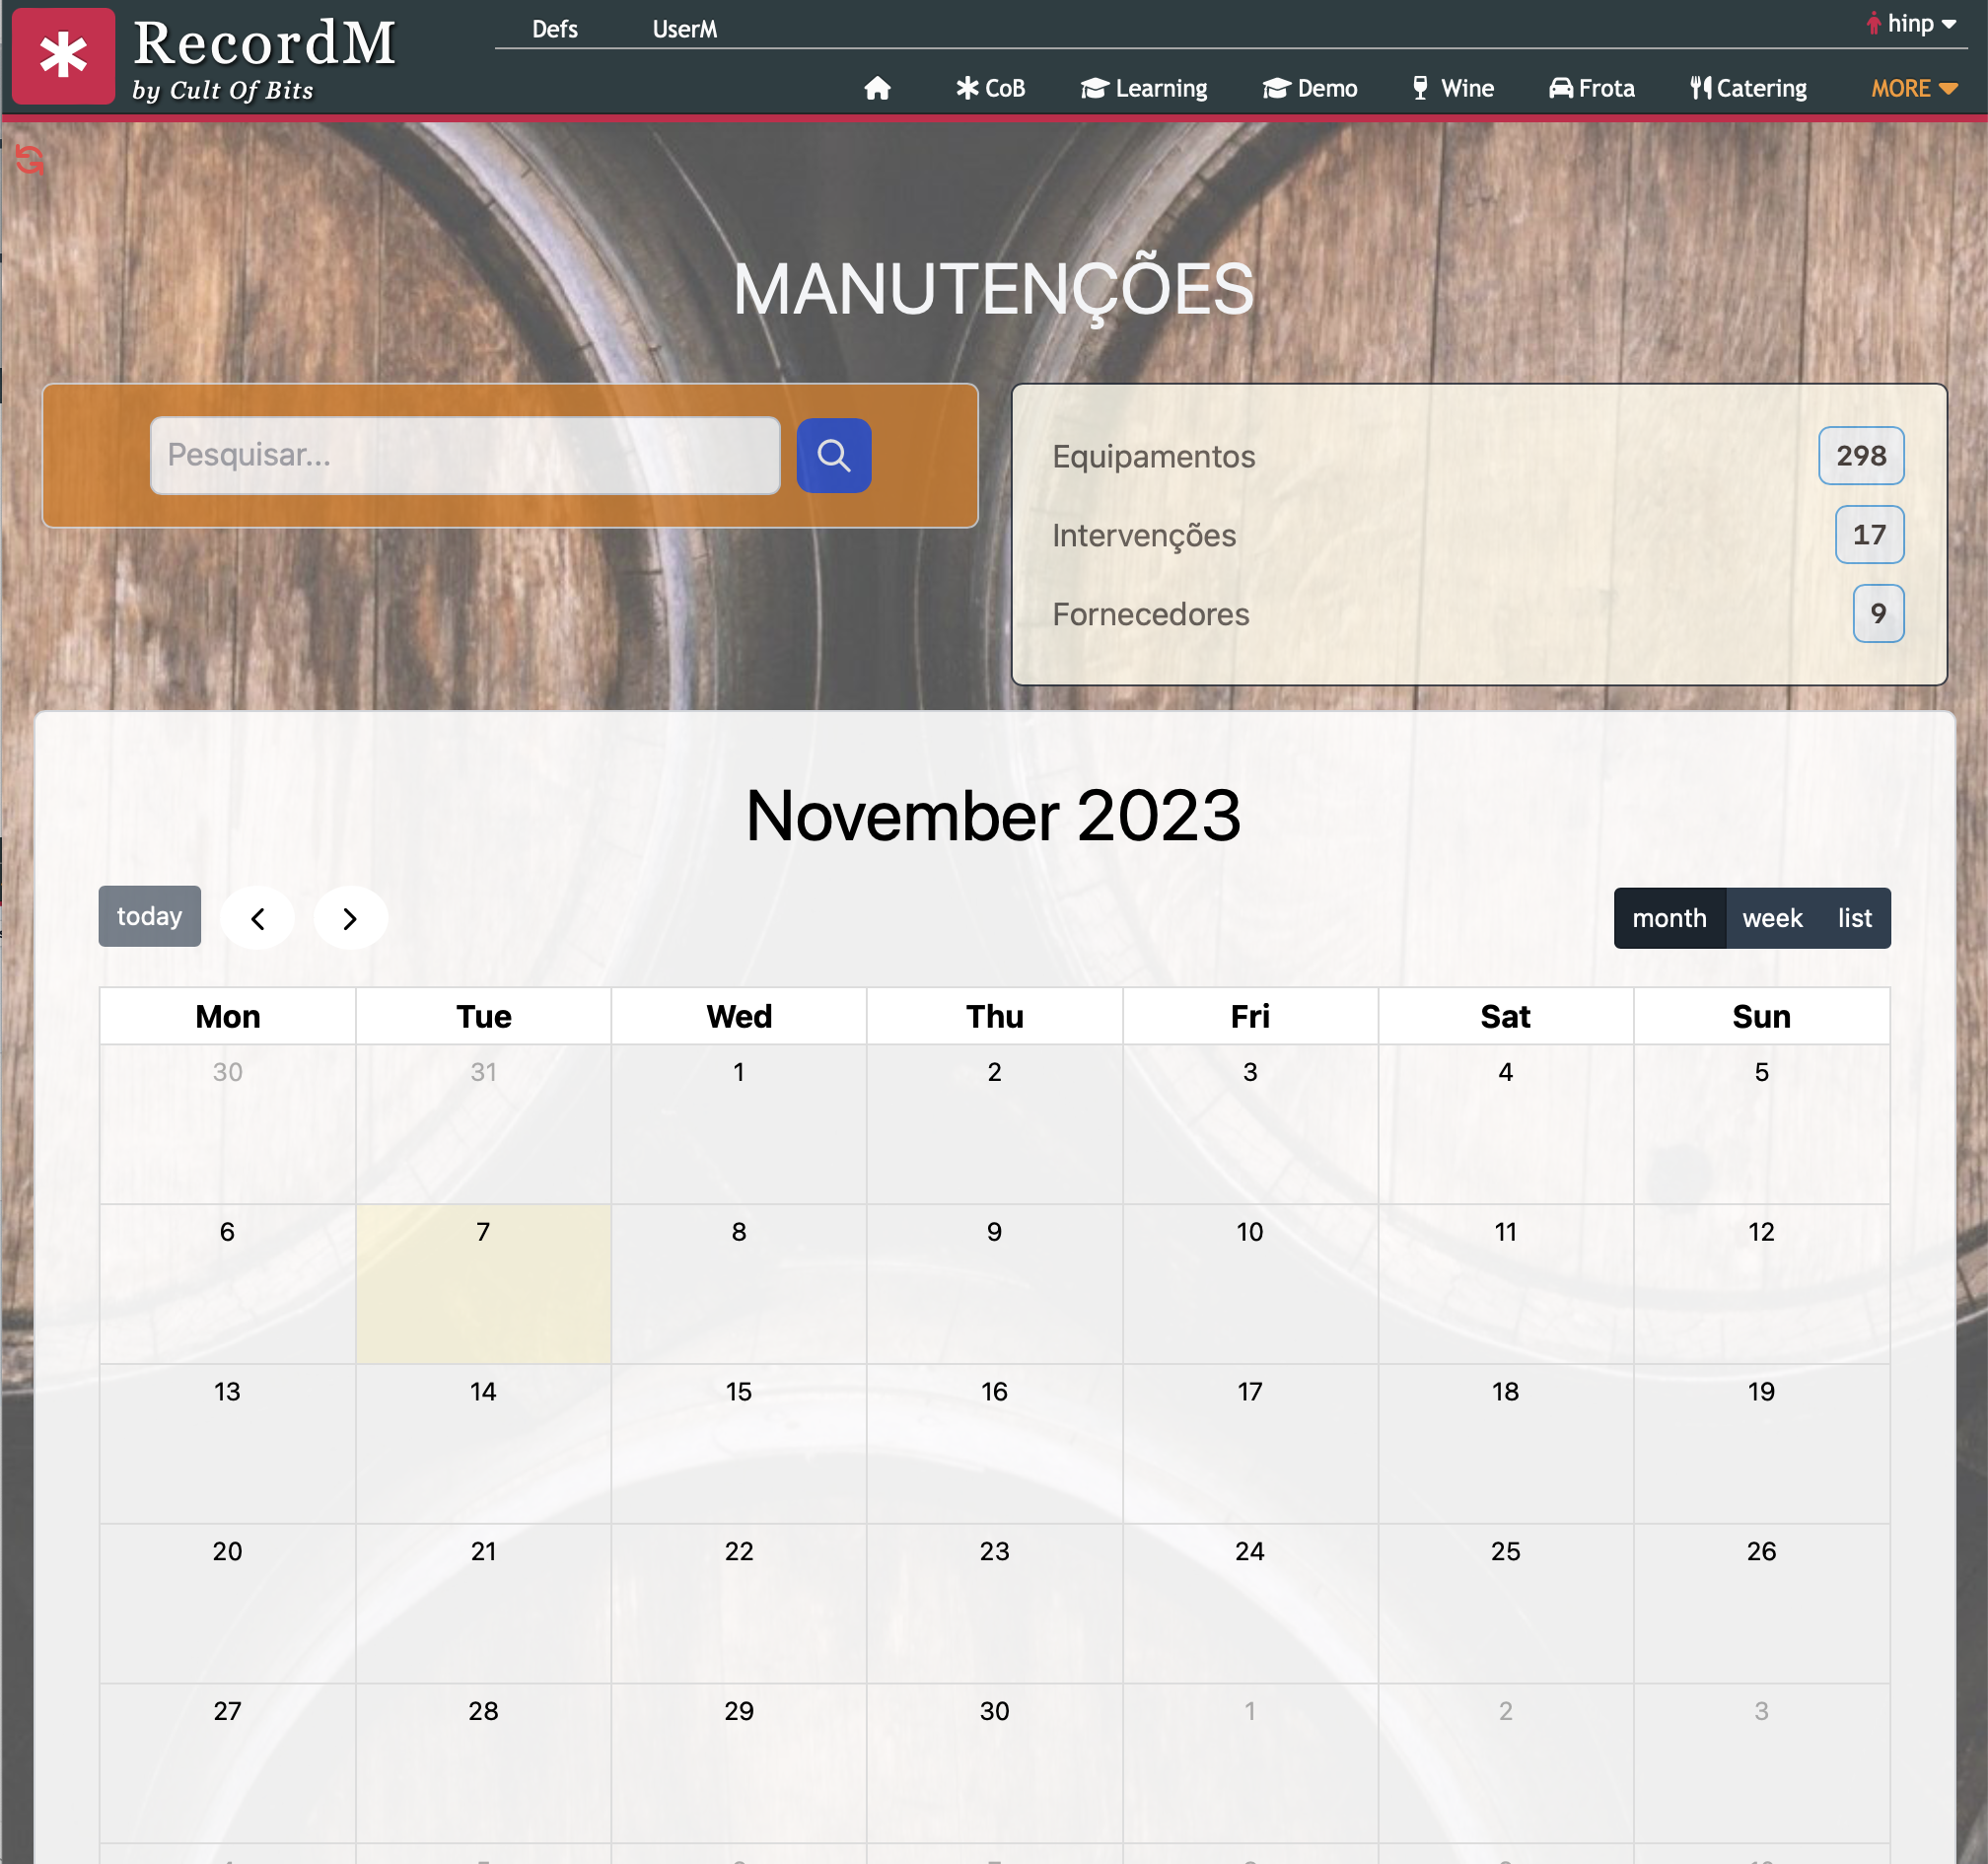
Each Dashboard is divided into Boards that facilitate the visualization and processing of information. You can see 3 boards in the image above. The boards are the building blocks of the dashboards.
4. Elements
Within the CoB platform, you can access data records in a more efficient with the help of dashboards. These are highly specific and fully customizable HTML pages that allow you to keep track of multiple data sources. They provide all the information you need to monitor your site's performance in a real-time fashion and from a single place. You will only be able to view a tab with access to a dahboard if you have the required permissions to do so.
Common board elements
- Statistics on the instances of each definition belonging to a given featured domain;
- Link to the front-end of the site;
- Link to the users;
- Link to the site's domains and definitions;
- Link to the listing of record imports made to date;
- Link to the device´s listing;
- Links to other - more detailed - dashboards.
5. Restricted Access
According to the groups to which they belong, each user has access to:
- One or several modules
- In the module(s) to which he has access, one or several Dashboards