# How to Create Kibana Dashboards and Visualizations
In order to create dashboards and visualizations in Kibana, the user must follow the below steps:
- Login into the server frontend, and then enter the Kibana home page by using the URL
name_of_your_server.cultofbits.com/kibana - In the first Kibana homepage, select the Default space
Before creating the dashboard or the visualizations, the user needs to add the recordm definitions that will be plotted in the visualization: 3. Click on the burger menu (3 stacked dashes on the top left corner below the nav bar): Go to Stack Management --> Index Patterns --> ** Create index pattern ** button. A new window will open so that the user chooses the definition to use. The name of the definition must be in the form recordm-<definition_id>, and the user must write it into the Name text box. Then click on Create index pattern. The user can repeat the step to add many more definitions by creating many index patterns.
- After adding the definitions, the user must click on the burger menu, and choose the Dashboard option.
- Click on the button Create dashboard then Create visualization. When you create on visualization, by the defualt, the lens type will be selected.
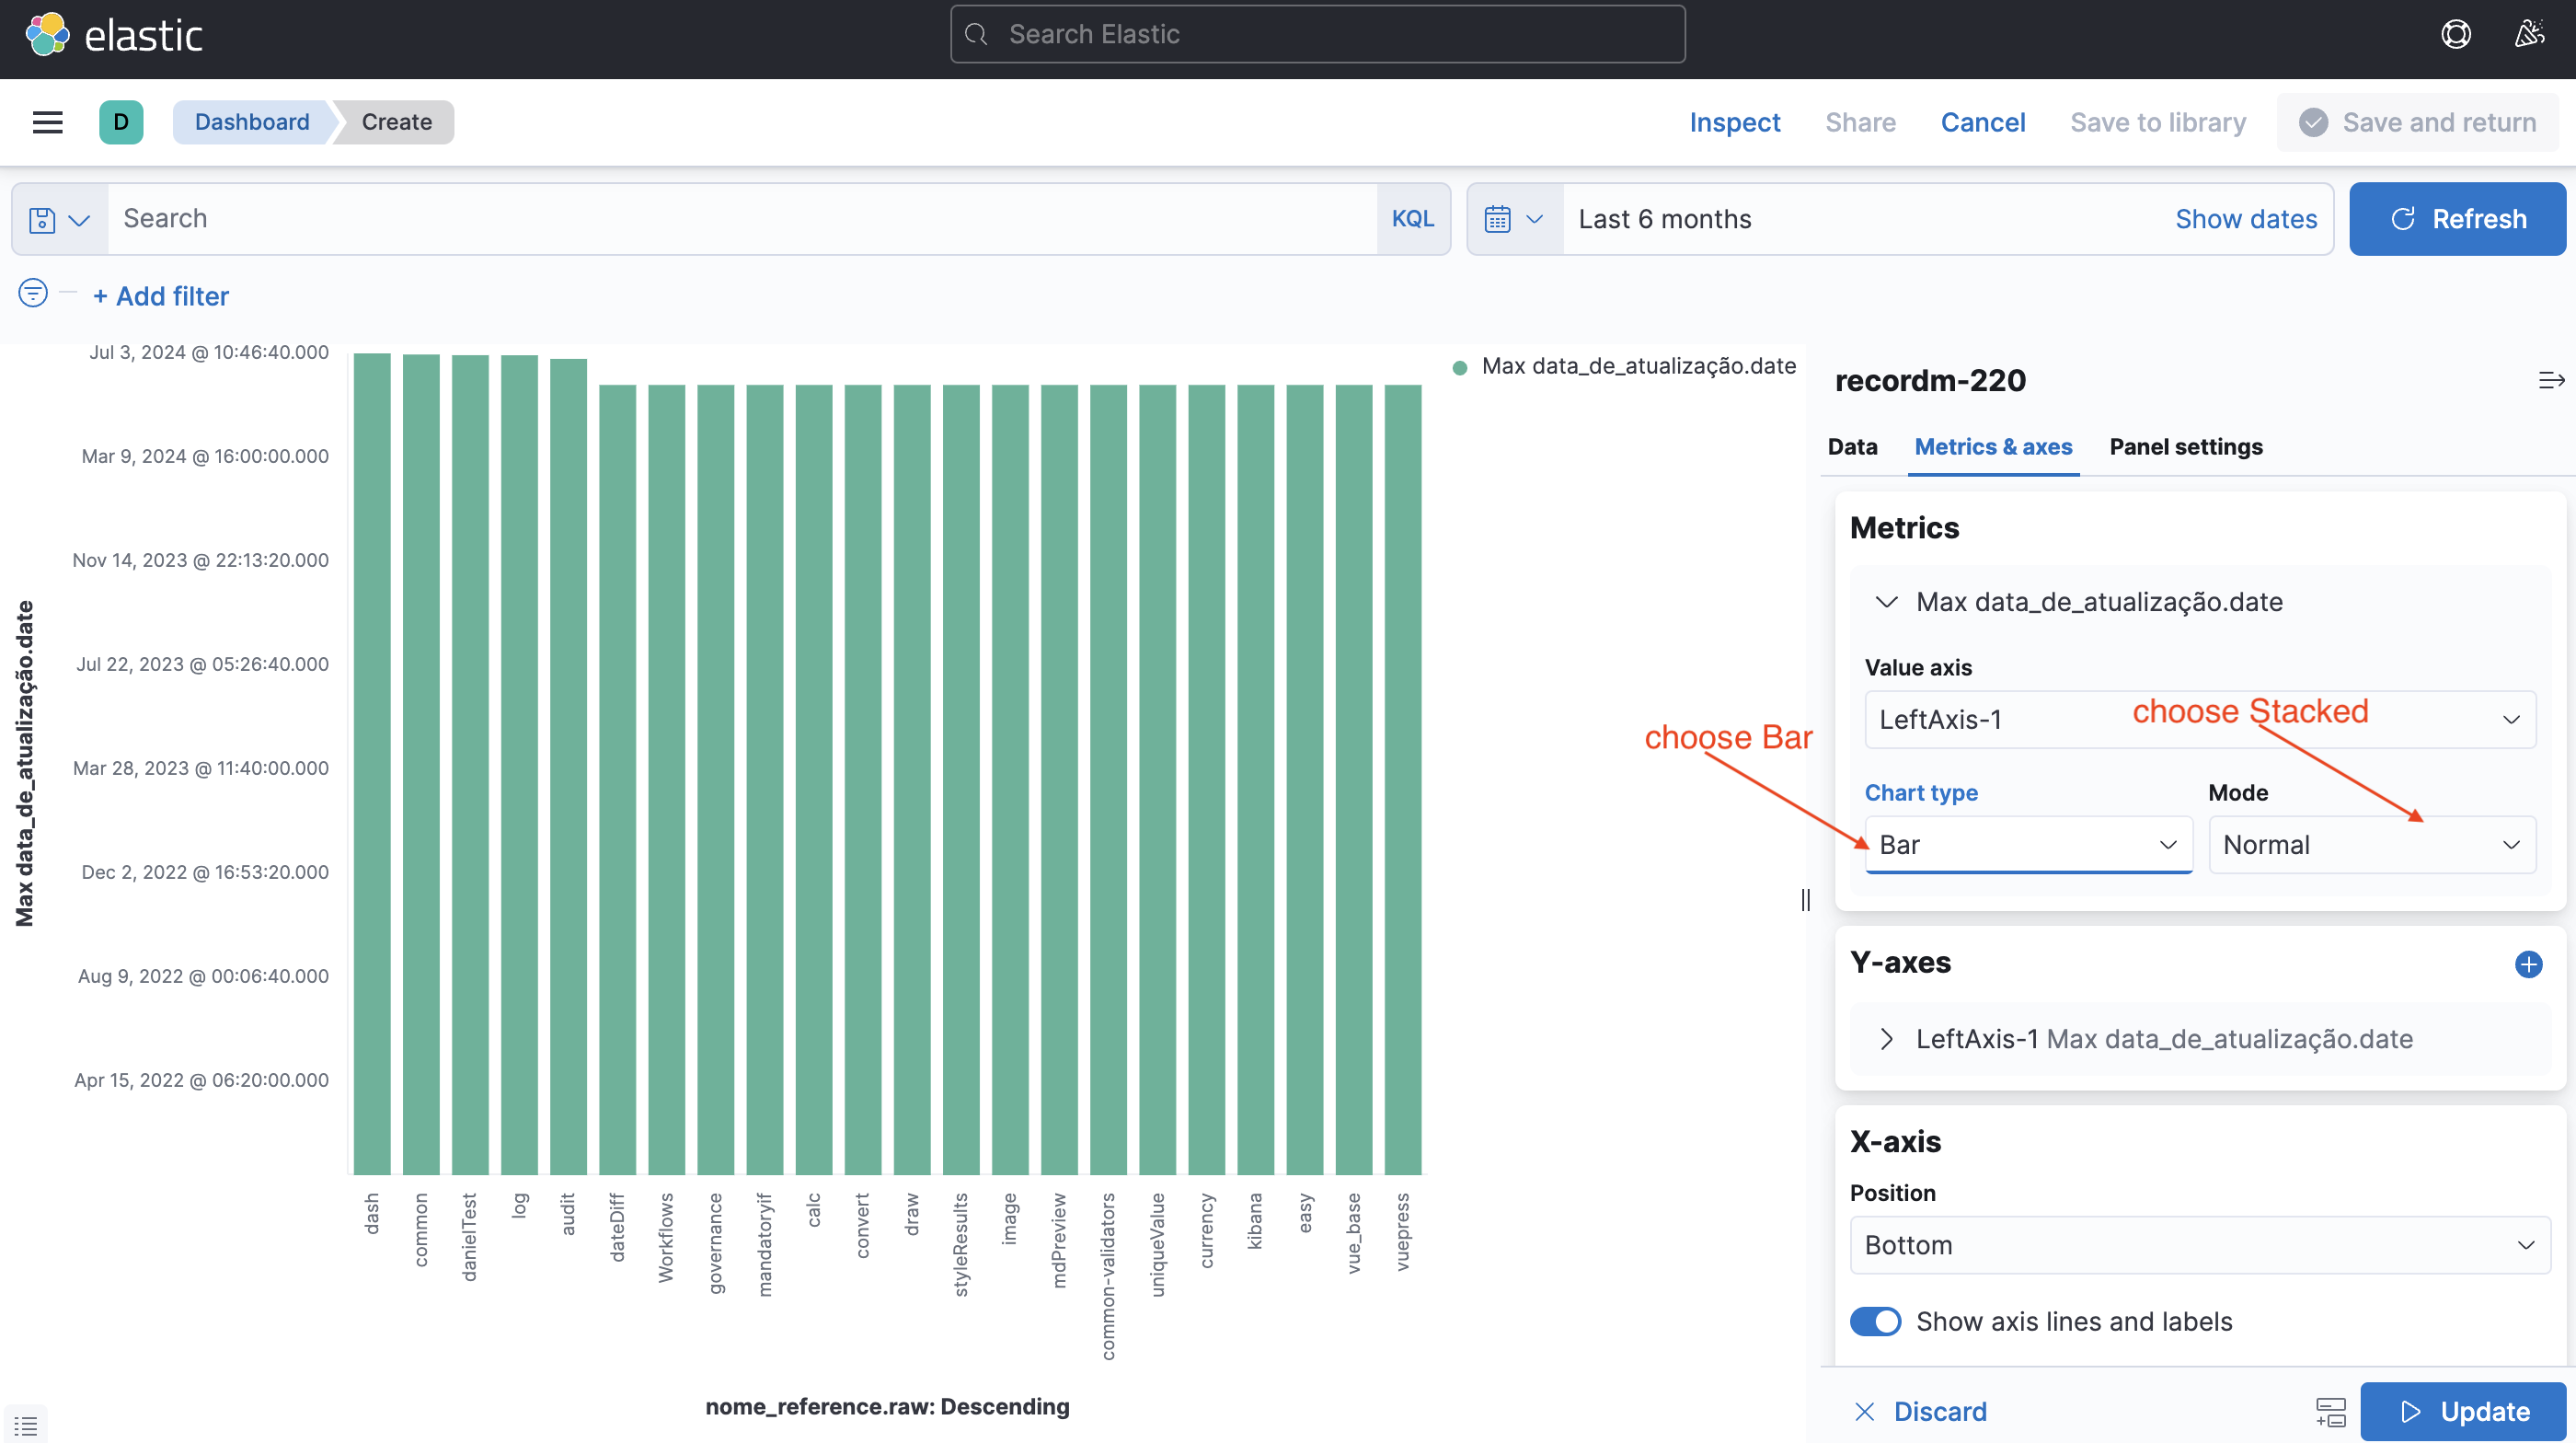
- A new window will open, on the right choose the definition or index pattern, and on the right choose the definition columns for the y-vertex and for the x-vertex. Besides adding the y and x vertexes columns, the user can also add another recordm column on the Break down by, in this, the values of the column will be represented on the graph vertically. The user can also choose the Visualization type, in the middle, just right on top of the displayed graph. Besides the lens, the user can also explore the Aggregation based visualization, there we have more aggregation functions than in lens.
- After creating the graph, the user must click on Save and return then Save to create the dashboard with the visualization.
# Practical Demonstration
# Creating Index Pattern


# Examples
# Example 1
Context: There is a definition in Recordm with the information about the versions of many github repositories called customizations. And we want a graph that will show us the number of version of each customization, and at the same time it will show us all the versions that a customization has.


In this example, we are going to use the dashboard created in the previous example.