2022.03.01 - How to have an overview of the site
Today the learning application is at a point where we should start to focus on the content. Given that at the same time that we've been improving the solution we have also been producing content we need now to reevaluate the consistency of the overall content strucure.
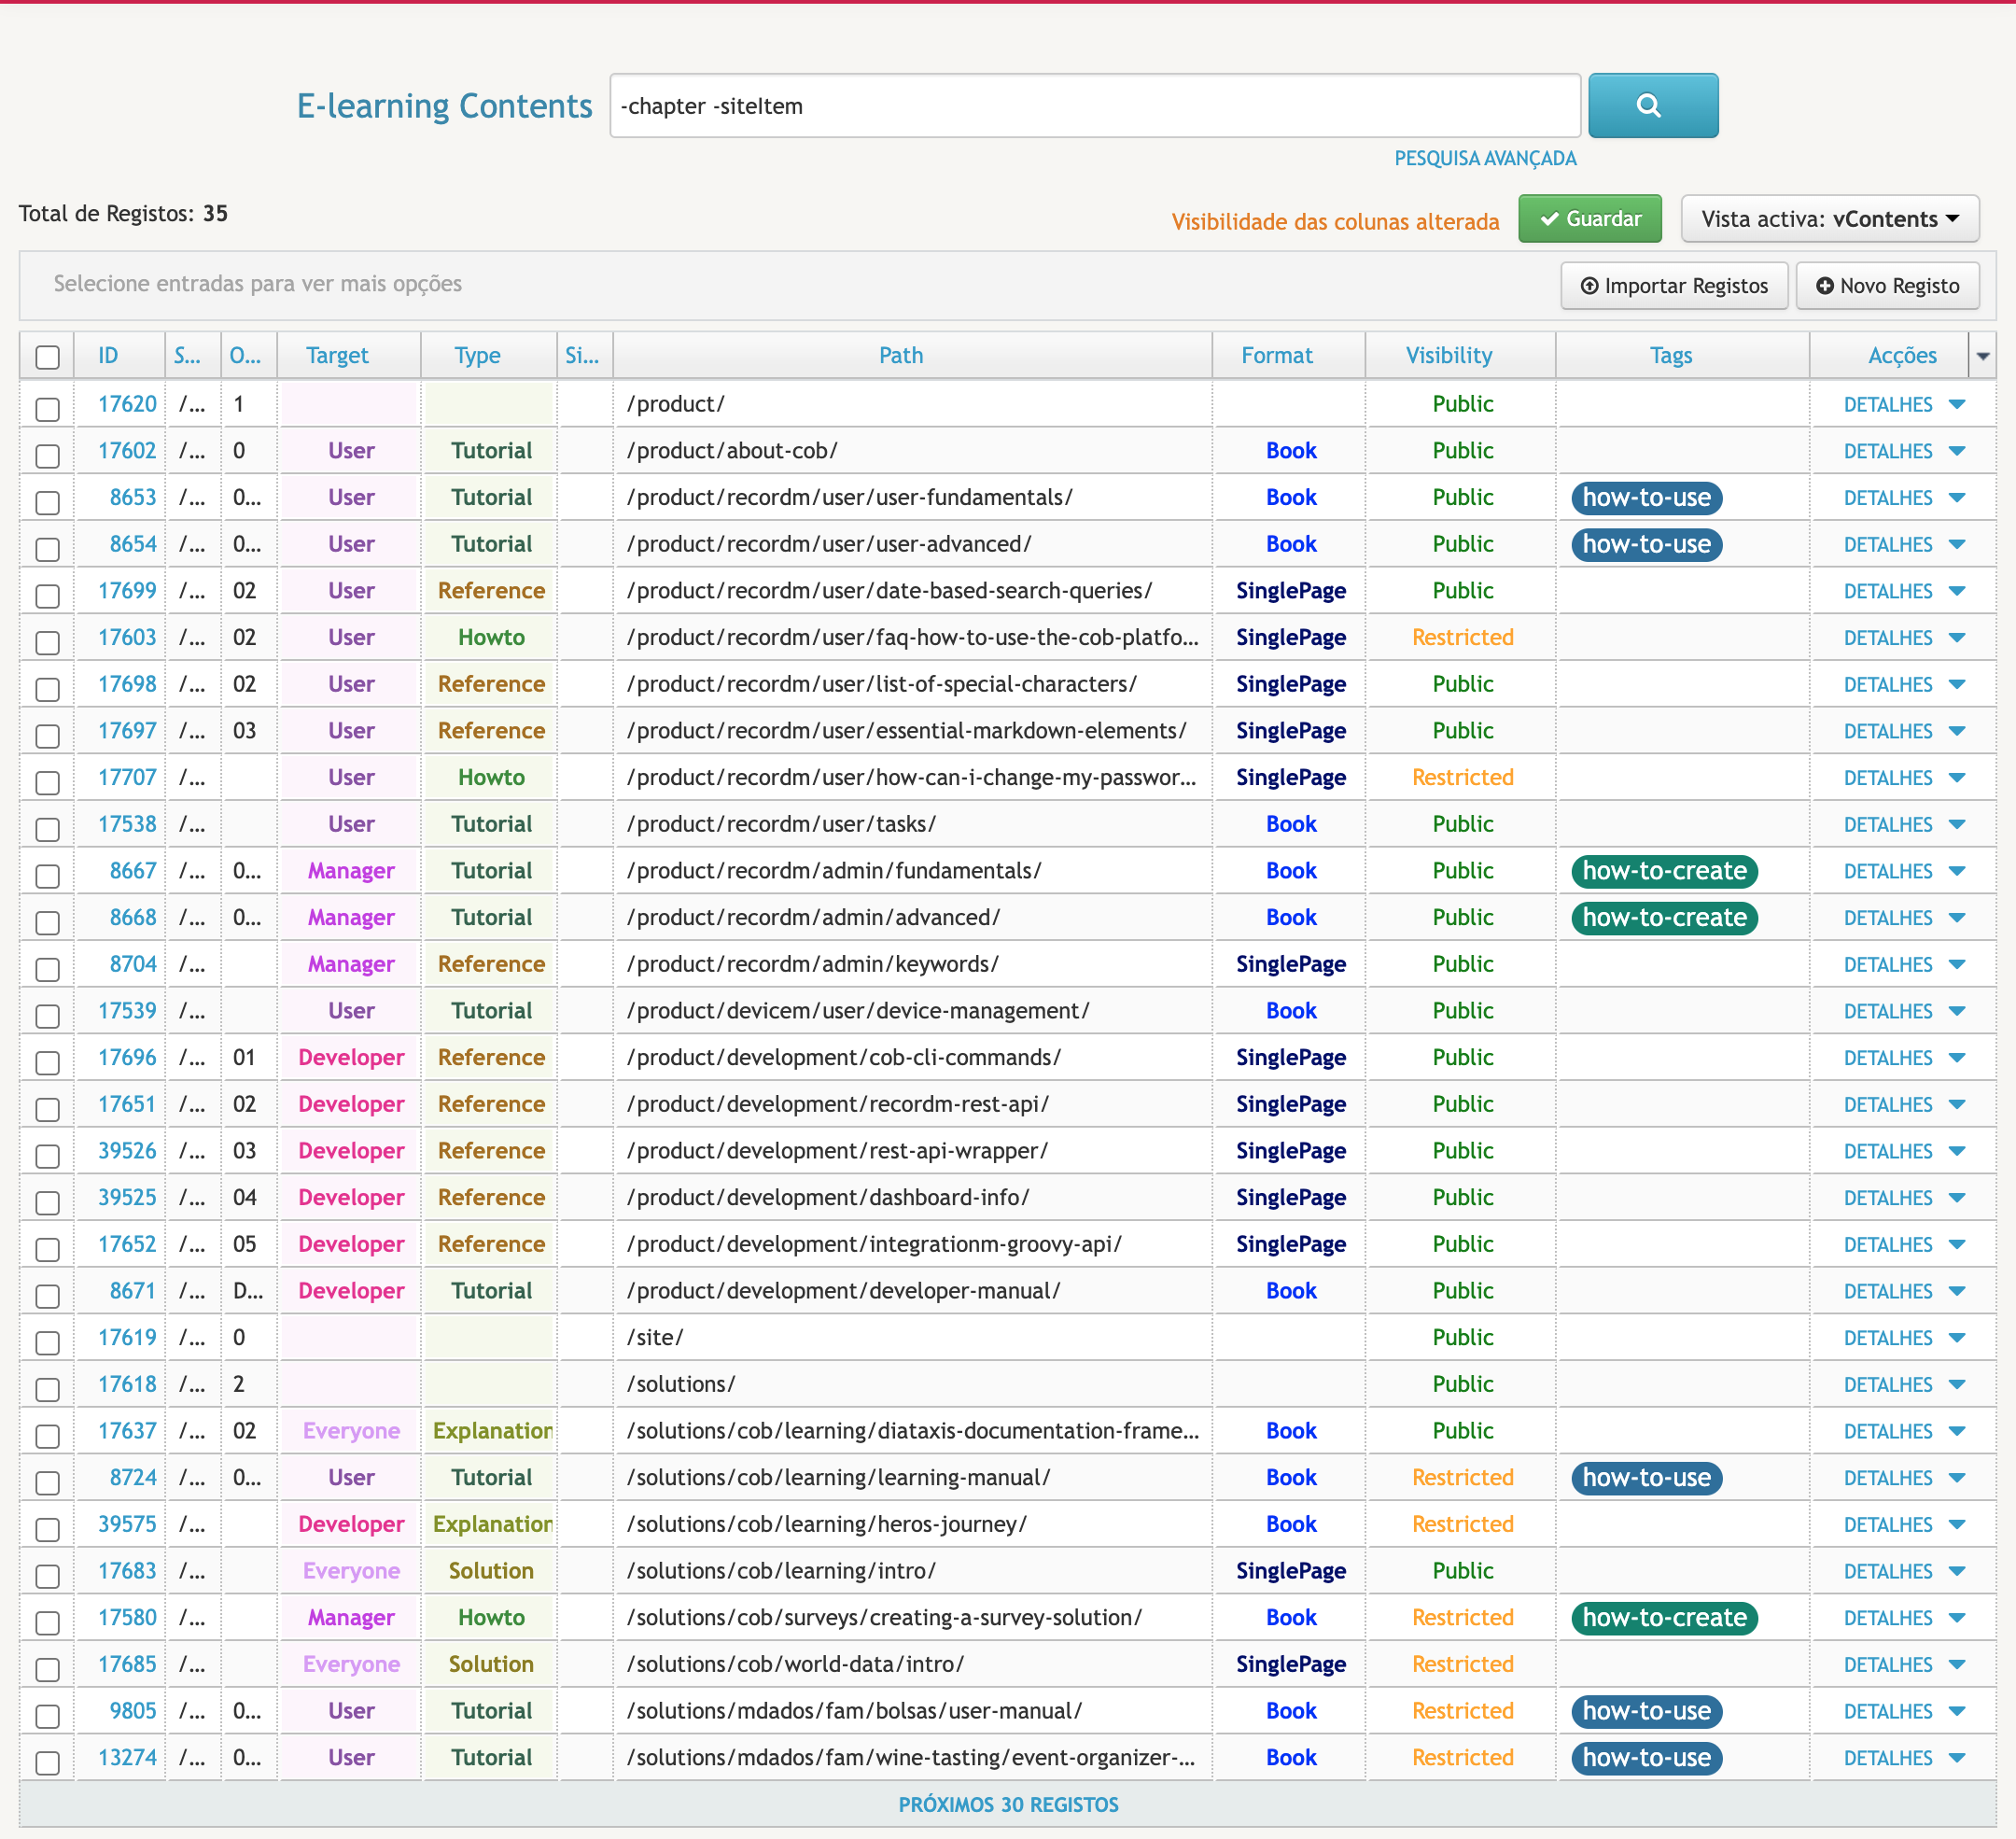
Unfortunatly there is no good way of doing this, apart from browsing the contents. Even if we limit the listing of content to the most relevant ones it's hard to get a sense of whats going on:
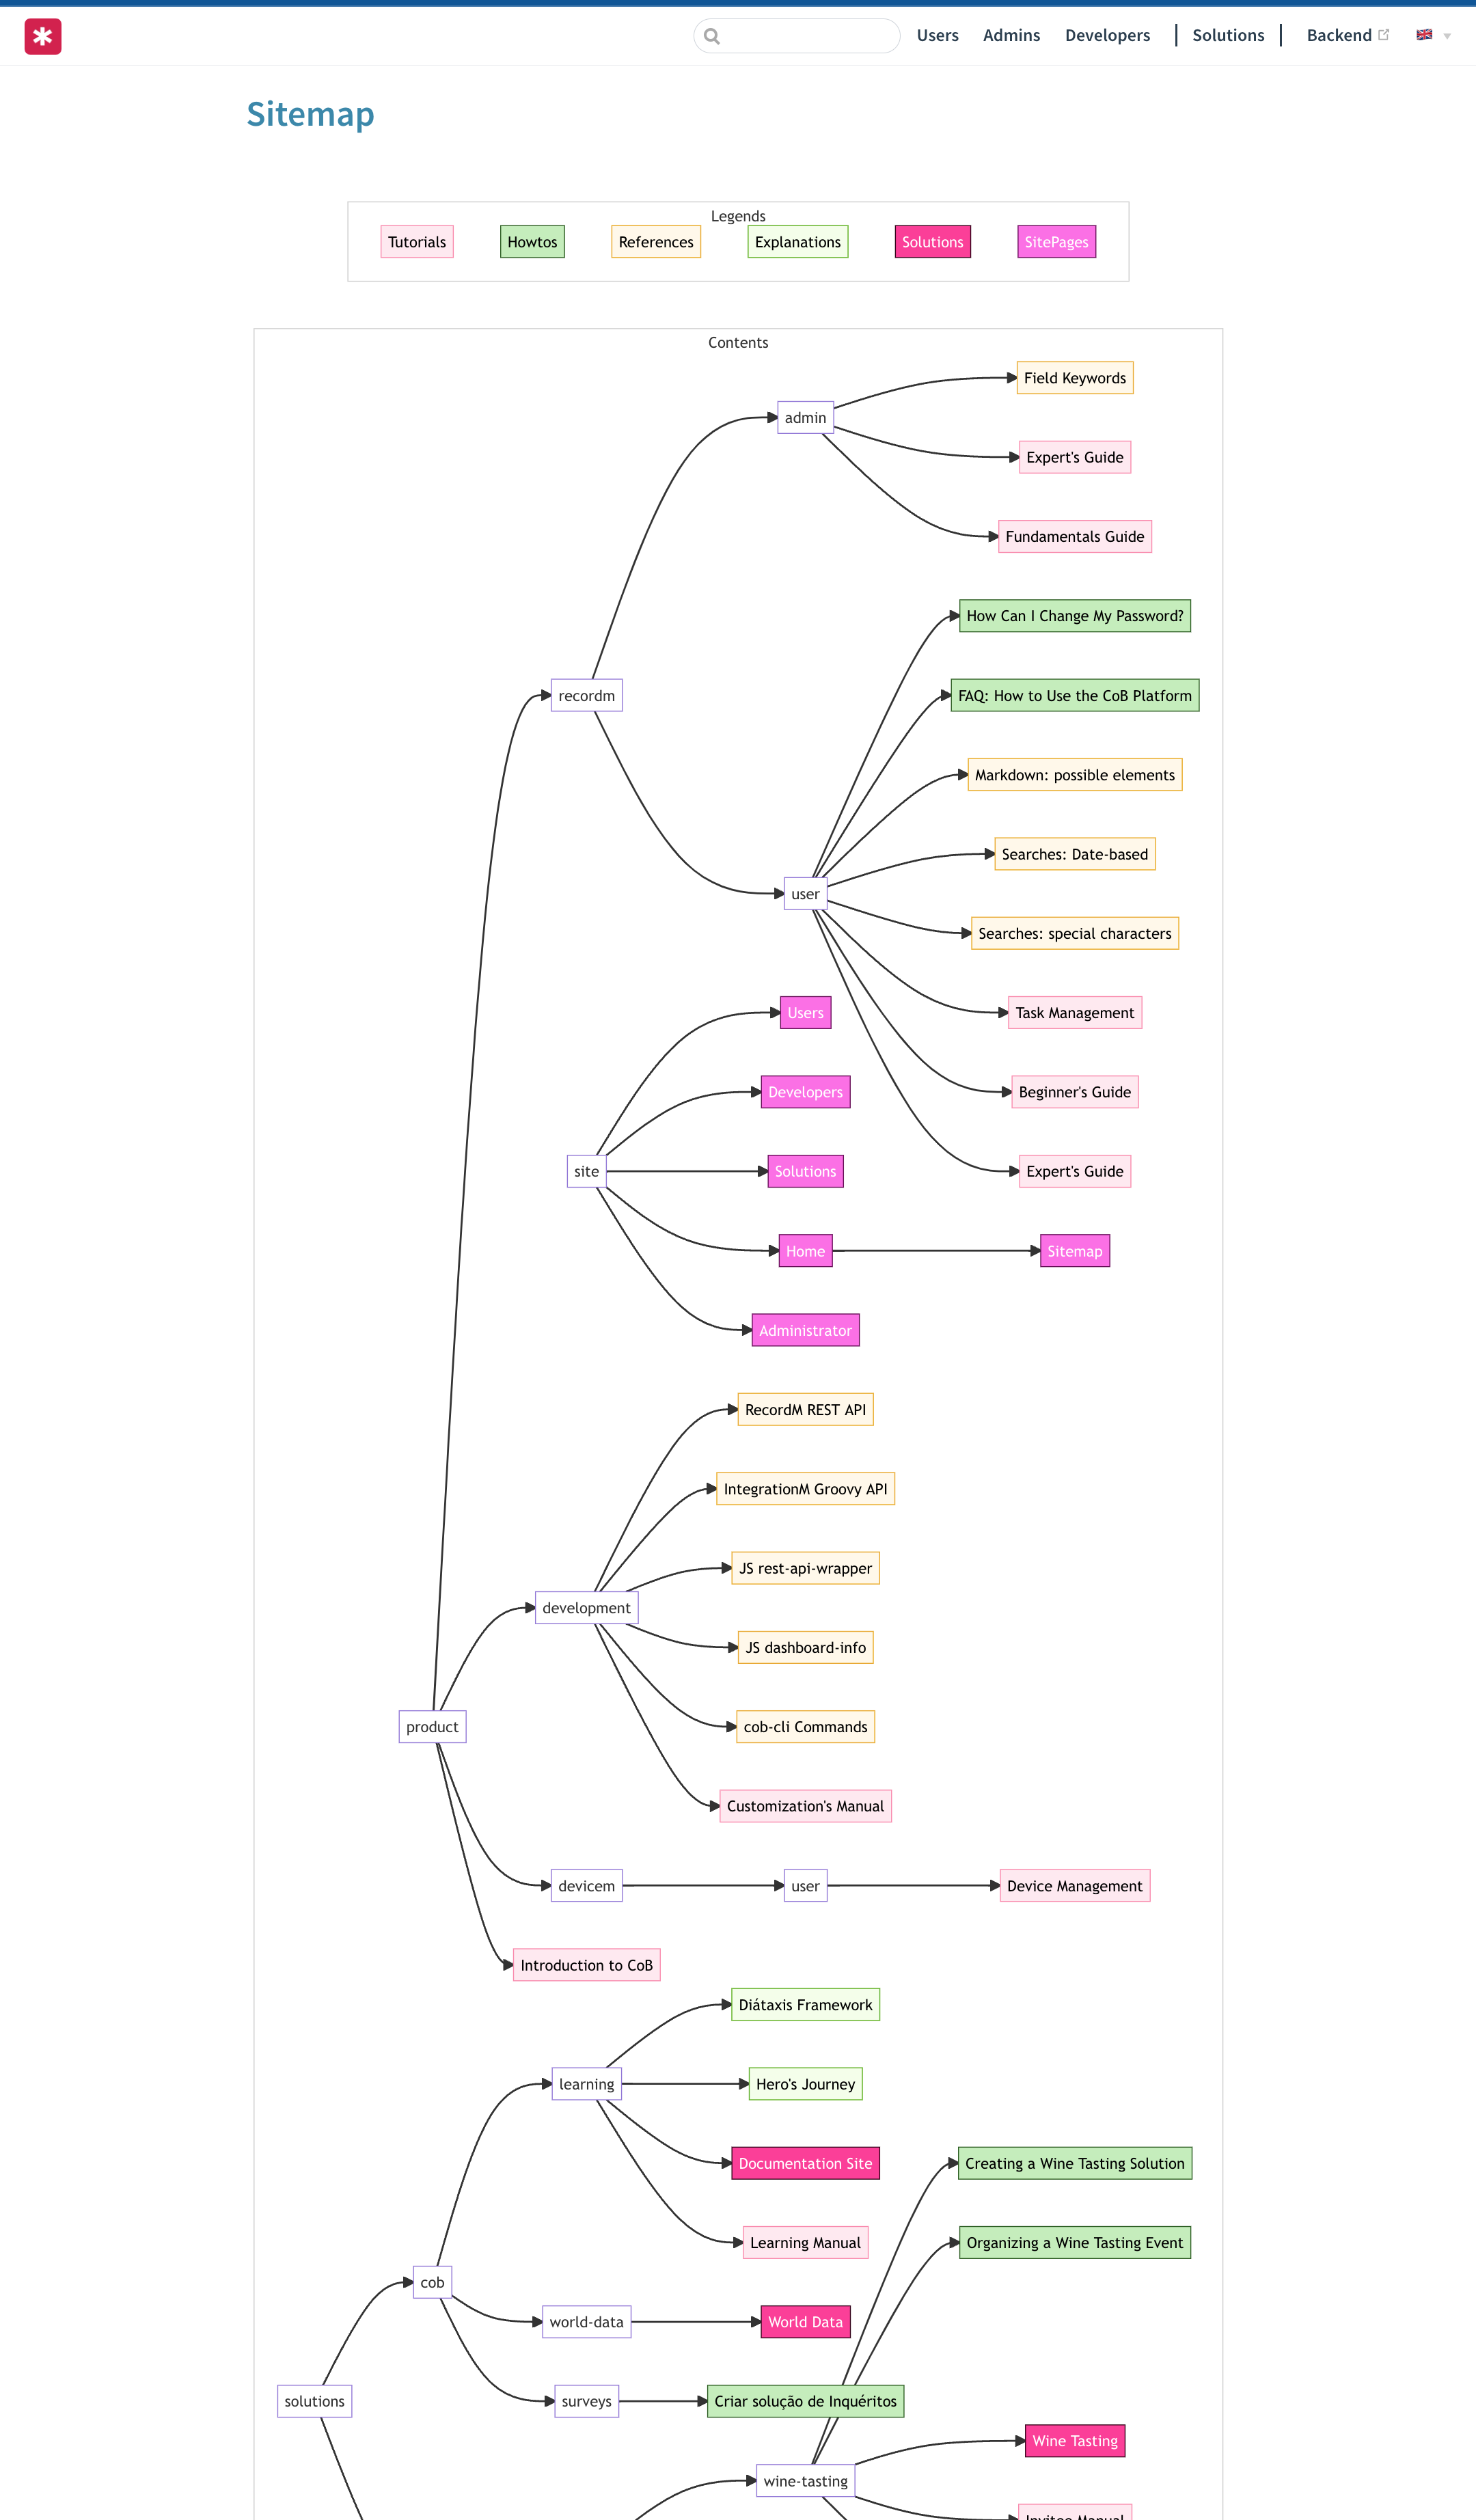
What would be ideal was to be able to site the full site structure as a graph.
Luckily there are several good options to draw graphs and it's easy from our solution to produce this graphs. One good option is the Mermaid.js library, that produces high quality graphs from simple strings:

Adding graphs to the learning solution
- add vue-mermaid-string module to the project
- create a
<graph\>component - get all relavent content info from backend and build graph string