
Device Dashboard
If you want to read statistics and status information about the devices in a visual manner, you can access a dashboard from the Dashboard tab on the top navigation bar.
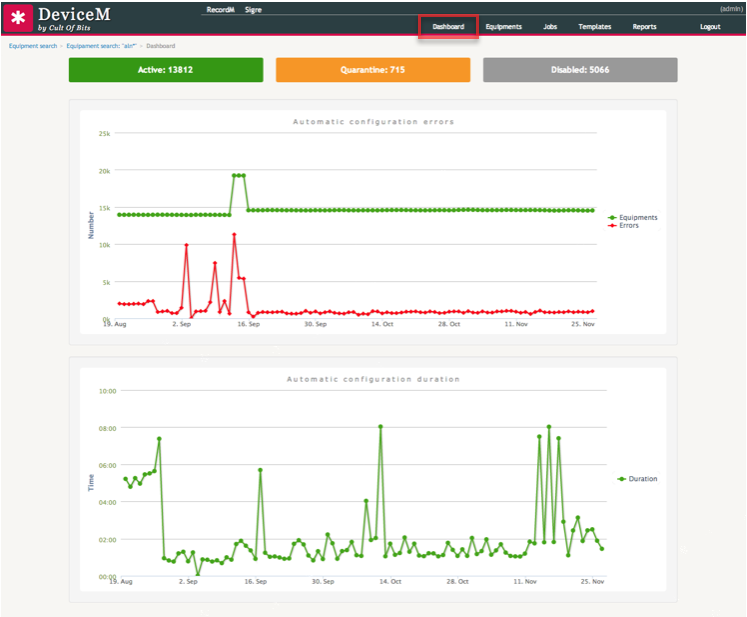
This dashboard displays the following information about the system:
- Number of devices by status: Enabled, Quarantine, and Disabled.
- Three line charts:
- One representing the evolution of the number of active devices on the platform over time.
- Another representing the evolution of number or errors that occurred during scheduled requests for configuration collection over time.
- A third representing the evolution of the duration in minutes of each scheduled request for configuration collection over time.